A Few Sample ETF Portfolios to Watch

Well 2014 has arrived with a tepid start and already the correction bells are ringing around the financial web. I’m as guilty as the next blogger of trying to front-run corrective moves in the greater markets, but in my experience, it’s rare to see a pack of pundits predicting market direction with collective accuracy. Sure, equities look a touch expensive here depending on which valuation-gauges you’re utilizing, but financial writers around the web(myself included) have been calling for corrections since the last one of note in June. Additionally, I’ve read plenty of analysts who state there’s still value at these stock prices.

Let’s consult the tea leaves and see what they communicate:

clip_image002

As the squiggle shows, if this weak start to the year is the genuine beginning to a sizeable(but perfectly healthy) correction of at least 8%, then there will be plenty of time to get properly positioned to take advantage going in and coming out. Notice at the blue circles above, how long the market takes to actually set-up the real dip that shakes things up.

Last year was the Year of the Passive ETF. The year 2013 caught the hedge fund industry with its pants down and the rich, whose funds were locked into 2&20, drastically under-performed the plain old, vanilla ETF of SPY. The S&P 500 tracker returned 29% last year, beating it’s very long term CAGR by a very healthy premium. In a mad trading world of short-term thinking and instant gratification, the long-term view of the Bogleheads destroyed churning traders on an absolute basis. Will 2014 be more of the same? I wouldn’t bet on it, but the consensus view out there seems to be that 2014 will be another good year…just not as good as 2013. Some more consensus thinking has been, “We’ll probably finish the year with the stock markets up about 14% to 16% compared to the prior year’s 30%’s for some indices.”

So in the spirit of following what worked last year while trying to include a touch of the contrarian and a dash of new trends, I’ve put together an ETF portfolio that I’d like to track in 2014. Because chasing always works! As always, this is not an investment recommendation. Since buy & hold was an elite strategy for 2013, and really since 2009 apparently, let’s see if 2014 continues to favor buy & hold with good fortune.

We’ll title the portfolio, Look Back and Ahead. Here’s a snapshot of its construction using ETFreplay.com:

clip_image003

Let it be acknowledged that this portfolio is only partially constructed using a rear-view mirror, and that investing with one’s view on the rear-view mirror is generally not going to lead to short-term success. The Look Back & Ahead (“LB&A”) portfolio was constructed for short-term results in 2014 only and is looking to utilize prevailing trends and combine them with some of the strategies that had a rough 2013. Eight of the chosen ETF’s follow trends established in 2013. These are Japan(DXJ), Junk Bonds(HYG), Biotech(IBB), Russell 2000(IWM), Tech(QQQ), Share buy-backs and dividends in earnings growth(SYLD), Consumer Discretionary(VCR), and Health Care(VHT).

The remaining 4 ETF’s of LB&A are the contrarian plays that could bounce back in 2014. Some of the possible reasons behind any potential bounce-backs are: extended negative sentiment ready for a turn, value at these prices, or hot money moves in together creating a new trend. The 4 trends waiting for a potential 2014 rally off some lows are: Emerging Markets(DEM), Europe(FEZ), Gold(GLD), and Muni-bonds(TFI).

You might be thinking muni’s and saying to yourself, “Really?” They’ve had a tough year for sure. Certainly one of the worst performing years in the sector over the last 20. Barclays produced a chart of performance for the past couple of decades. It shows that after a down year, the sector tends to rally quite nicely. Will this time be different?

clip_image005

Since the S&P 500 index performed so well, we’ll track LB&A against the SPY for the year. But wait, there’s more. If I think that LB&A may be able to outperform the market by riding some established sector trends and a handful of potential counter trends, then why not leverage up. Well I have a portfolio for that too, that allows for a 2 or 3 times leveraged move in each of the sectors of LB&A without taking on margin risk into your investment account. Observe:

clip_image006

Unfortunately, ETFreplay subscriptions do not provide access to the entire universe of ETF’s. As they state on their website, “As of 2010, less than 500 ETFs have provided >98% of the trading ETF/ETN volume in the U.S. market.” Which means that due to a lack of liquidity and volume, six of the levered plays are not in the ETFreplay database. As such, I am unable to easily save and track the portfolio with their site’s tools. I’ll just save it on another site’s portfolio tools and drum up some charts in Excel for performance tracking purposes. And in the continued spirit of simple benchmarking against the S&P 500, we’ll use SSO(2x levered S&P ETF) as our comparison benchmark.

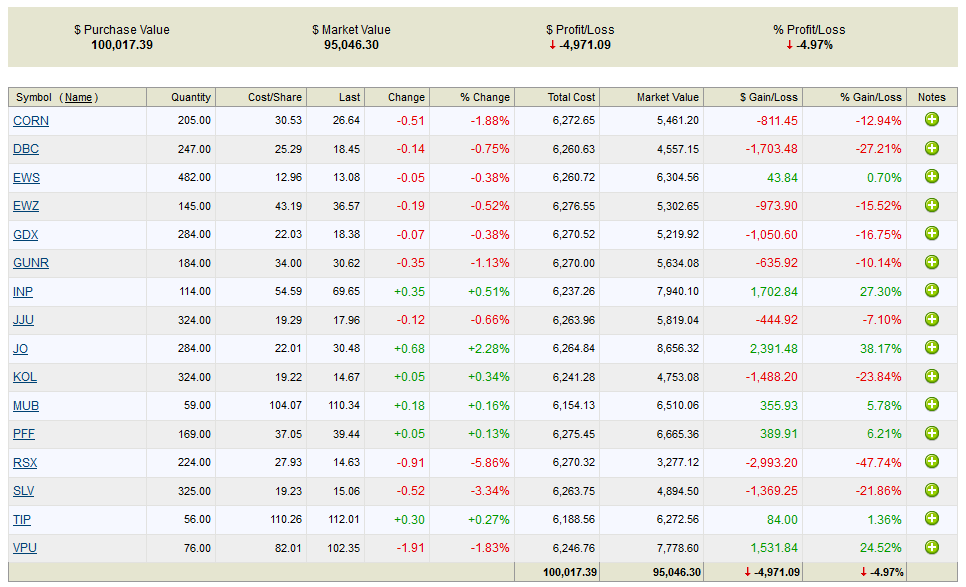
Just for ha-ha’s, we’ll track another portfolio in 2014 of purely contrarian plays. Construction of this portfolio should be obvious to most, but have a look at its make-up. It’s titled Contrarian New Year.

clip_image007

Obviously, the BRI of BRIC had a tough year so we’re allocating there for total country exposure. I also included Singapore but left out Turkey. With the ongoing corruption scandal in Erdogan’s government, there’s obviously a whole lot more than sentiment going on there. We’ll just see how that situation plays out and how it affects investor sentiment towards the Turkey ETF later in the year. Commodities were utterly atrocious, so I included DBC and GUNR but also wanted to concentrate performance for some mean reversion specifically in coffee, corn, aluminum, coal, and silver. Gold miners were…well you know the story by now. Utilities was one of the worst performing sectors in the US along with TIPS, as nobody expects inflation and everybody wants to buy growth. We’ll see if inflation starts to tick upward and relative value attracts some players back into the utility space in 2014.

Just like muni bonds up above, you may be thinking that the gold miners prove I’m a glutton for punishment. That may very well be, but risk can always be managed, and if the underlying product has a bounce-back year then the producers may see a little pop in performance. Especially if the metal can catch a bid sufficiently past most of the producers’ all-in-sustaining costs. Observe the following chart of the XAU’s performance over the last 30 years, courtesy of US Global investors via Bloomberg. It says to me that miners have a potential low risk/high reward set-up. Believe me, any time the word gold comes out of my mouth, I want to shoot myself in the face.

clip_image009

Remember, that these sample ETF portfolios are not investment recommendations and I reserve the right to allocate my own funds as I see fit into or out of any of the fore mentioned investment products. If you’re interested in some of the more professional portfolio metrics and want backtest results, Sharpe ratios, alpha and beta, correlations, etc., then too bad. Go look it up yourself. The name of the game in 2013 was absolute performance and so that is what we are measuring in 2014 with these ETF experiments.

And that ladies and gentlemen, is about all there is to basic asset management. Here’s the basic formula: Follow some prevailing trends to cover career risk + buy some contrarian plays based on quantitative models to cover career risk = hopefully benchmark beating results…and winning the grand prize of more AUM, which inevitably leads to diminishing performance. Obviously, I’m highly generalizing here. Asset management in any shape or form is usually performed by very well educated individuals or groups utilizing highly sophisticated quantitative or fundamental models drawn from a wealth of experience and knowledge. I don’t mean to belittle that nor do I begrudge anybody able to obtain a position managing assets. At the higher levels it is a very, very lucrative career that can build high-quality, long-lasting relationships.

For now, I’ll continue to trade my accounts, spend time with my family, post to my blog, and pursue interests. Am I going to be nominated for fund manager of the year for my efforts? Certainly not; but I just may have a shot at Dad’o the Year.

Now this wouldn’t be a real MarginRich.com article, if I didn’t over-chart the reader. So with that, I’ll bid you adieu with a few charts to provide entertainment and food for thought. Charts are courtesy of some of the financial blogosphere’s most respected, TRB, Jesse, and Kimble.

The January Effect:clip_image010

The Recovery:clip_image012

Is the financial system stressed?:clip_image014

Below is the final “Portfolio Update” posted on 1/4/2015:

Here’s where I’ll maintain the updates to the ETF portfolios that I outlined in the January 2014 post titled, A Few Sample ETF Portfolios to Watch. If you haven’t read it and are curious as to the rhyme and reason behind these experimental portfolios, then please read the post for a full explanation. The portfolios all started with a “play-money” value of $100K. We’ll see how “buy & hold” closes out 2014. CLICK ON EACH TO ENLARGE.

Update 1/4/2015:  Say goodbye to 2014, the year of nothing specifically working except holding everything. Obviously, the adroit speculator was able to generate income in various and specific asset classes. However, the casual investor trying to pick stocks or even the majority of hedge fund managers were both trounced again by a levered ETF of the S&P 500. So much for trying to follow the trend while also also trying to be contrarian. That little thought experiment crashed and burned. I have a strong suspicion that indexing ain’t gonna be as easy as it’s been the last 2 years but who knows. I’ll leave these results up for the rest of the month and then bid adieu to this specific page regarding the 2014 experimental portfolios. Maybe I’ll come up with something else to add to the site, but at the rate I’ve been posting, don’t get your hopes up. Good luck in 2015, muppets!

1. Look Back & Ahead as of 12/31/2014:Look Back & Ahead (2014 Year End)

2. S&P 500 as of 11/18/2014:
S&P 500 (2014 Year End)

3. Levered Look Back & Ahead as of 12/31/2014:Levered Look Back & Ahead (2014 Year End)

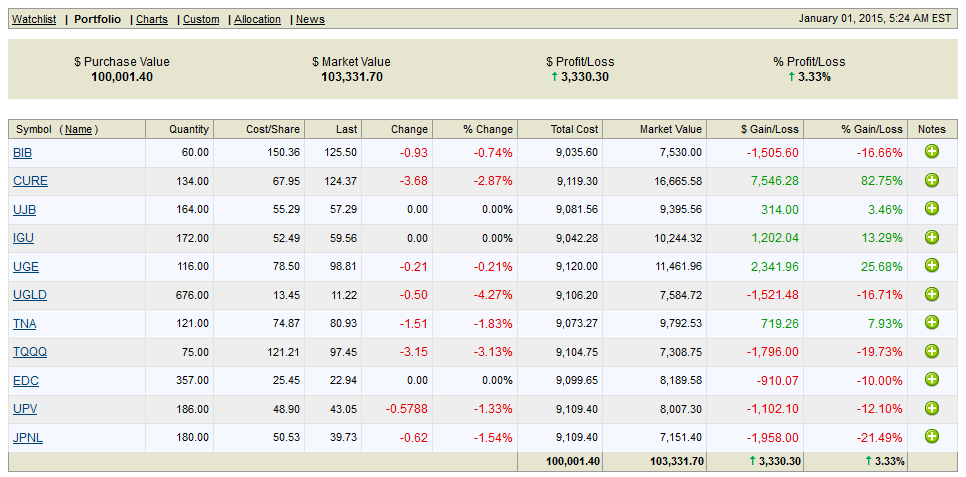
4. S&P 500 2x Levered as of 12/31/2014:Ultra S&P 500 (2014 Year End)

5. Contrarian New Year as of 12/31/2014:

Contrarian New Year (2014 Year End)

Some Things Matter and Some Things Don’t In the Financial World

Whoo boy! Talk about an explosive over-reaction to the Fed tapering. The US central bank has tapered their debt monetization from $85B monthly to $75B monthly or $1.02 trillion annually to a paltry $900 billion annually. So the “one-time” TARP bail-out of $700B to save the US banking system and the US economy was so unprecedented that hard assets like precious metals, farm land, and such were driven to extreme levels. The Fed upped that number to a trillion annually and people celebrate because Bernanke has placed a Put under the market. Any threat of excessive inflation in the core CPI has been eliminated and market participants celebrate easing and tapering with virtually equal fervor.

These are truly interesting times for investors. And since it is the most wonderful time of the year, why not get a seasonal bump in equity prices too? Everyone deserves to feel wealthier. It’s the American way.

I recognize that things appear to be looking up economically in the US and since America controls the world’s reserve currency, that should positively affect the rest of the planet. GDP is slowly but surely looking up as some growth projections show anywhere from 3.5% to 4.1% for the US in 2014. Core CPI is tamed so who am I to dispute or rain on any of this optimism? All the same, I think we should visit a list of some things that just don’t seem to matter anymore in the world. We’re looking predominantly in the financial world, but we can’t avoid a couple of views on politics either. As usual, I’ll trot out some charts to help illustrate the good and bad, where applicable.

1. To get the party started, let’s start with inflation. It’s one of the touchier economic subjects out there. There are those who are of the opinion that observing the core CPI and its tame 1.2ish% is the total story. That of course ignores the following chart of growth in the CPI since the 70’s and the advent of excess credit to fund the American lifestyle.

clip_image001

The funny thing about core CPI is that it excludes energy and food, aside from housing, the two biggest components that hard-earned money is spent on. Additionally, hard assets and financial assets are ignored by the focus on core CPI. Hard assets(ex-precious metals) have been rising like gangbusters in 2013. Fine art, diamonds, fine watches, fine & classic cars, and farmland are all being sold for record prices. Is this asset price inflation irrelevant?

How about equity prices in 2013? Is the rocket ride across all indices simply a matter of business fundamentals? Partly. Multiple expansion? Partly. Worldwide liquidity tidal wave? Definitely. Does it really matter though? Wealth is growing…or at least the Fed thinks people will perceive their wealth to be growing and thus spend more to organically grow the economy.

The fact of the matter is that the YoY rate of change in the core CPI has been basically flat, or as neo-Keynesians and monetary sophists say, non-existent. Since monetary inflation is apparently meaningless, this means that the Fed has everything under control. If or when the need to tighten up policies to rein in any perking up cost-push inflation, the Fed will pull the appropriate levers and all will be good. That continues to be a prevailing mindset.

2. Debt monetization i.e. QE is simply overlooked as the price of doing business in growing the equity markets. As I previously noted, market participants were aghast at the sheer size of the original TARP. Now we can’t live without it, but it’s tapering. According to a Bloomberg survey of 41 economists, the median forecast is for the Fed to taper by $10B over the next 7 FOMC meetings until there is no longer any sort of QE. Do you agree? That’s a tough one to swallow. Below you can see the growth in the M2 money stock since the turn of the century.

clip_image002

I have read that this chart can be regarded as irrelevant for a couple of reasons. One is that the creation of this money is simply a balance sheet transaction. Federal debts are monetized, but only sit on the balance sheets of the participating banks as excess reserves. Thus, there is not the requisite rise in costs that historically accompany such transactions because those excess reserves are not being spread around. The next chart shows the velocity, or rather lack there of, in the M2 and it’s a major reason why deflationists and current believers in the status quo believe there are no or will be no repercussions for excessive debt monetization.

clip_image003

This chart above is leading many to believe that everything is under control. Of course, any rational follower of economics and the markets know that it will be the unintended consequences and unforeseen actions that will shift the velocity upward. And by unforeseen, I mean things that are completely foreseeable such as a shift in international confidence in the USD or a marked increase in the Renminbi for transactional settlement at the sovereign level or a significant reduction in the use of the Petro dollar for energy settlement. The current logic goes that excess reserves will be coaxed out by the banks’ greed for yield and earnings, as the spigot is eventually closed. Then the US should see some of that cost-push inflation that was so widely anticipated after 2009.

As it stands, there is a terrifically tight correlation between 10-year US Treasury yields and money velocity. Since everyone and their mother expects the fixed income market to lift the yield of Treasuries, it stands to reason that velocity will be joining the ride. Everything is always about timing, though. None the less, observe the following chart courtesy of Business Insider, via Harrell at Loomis Sayles.

clip_image005

3. But in the meantime, the co-policy of ZIRP which has helped to enable the efficacy of QE has destroyed what it means to traditionally and conservatively save your money. ZIRP is forcing everyone to speculate, plain and simple. Savings accounts and CD’s pay nothing. Because of that, more and more reach for yield through the dividends of the stock markets. Even the high-yield debt market continues to perform robustly and I suspect it will continue until the T-rates begin to officially rise. The lack of spread between HY and plain old Treasuries is beginning to hit what, since 1997, has traditionally been the early part of a danger zone. Observe the following chart from Bespoke.

clip_image006

It shows we still have some time to go before confidence erodes, but as a canary in the coal mine, a message is being provided loud and clear to those potentially stretching a little too far for yield.

4. Can anyone honestly look at official unemployment reports and not raise an eyebrow? The BLS is currently showing an unemployment rate of 7%. Fantastic! America’s well on it’s way towards full employment again. Except there’s that nagging little fact that the entire demographic of individuals who have given up looking for work are simply not labeled as unemployed and thus do not factor into the equation. So if you gave up looking for work and still don’t have a job, not to worry. You don’t qualify for unemployment benefits anymore and we won’t count you as unemployed because you’ll receive a different form of welfare. Win-win.

It’s difficult to ignore the glaring convergence between the reducing unemployment rate and the continued decline in the workforce participation rate in the US. Have a look at the chart below of workforce participation over the last 10 years, courtesy of BI, via Gunha at ISI.

clip_image008

The Philly Fed states that this rate is entirely caused by workers entering retirement. Obviously, retirees factor into the equation but to state that the descent, which coincides with the nadir of the Great Recession, is entirely related to retiring workers is bold. “But it’s backed by statistics! I read the report.” Yeah, sure. Ok. Statistics are never presented in such a way to influence the thinking of others.

5. Capital expenditures and the organic growth of the economy are simply not a priority for now. CapEx levels provide that behind-the-scenes, real snapshot of economic growth, and for now, CapEx is in the dumps. Businesses simply do not want to risk the capital to expand or grow sales and the work force. Instead, the current business fads are buy-backs and dividend increases. Selfishly, I’m all about the share repurchases and dividend growth in my own long-term holdings. But to use cheap capital or current cash flows for such short term benefits with little to no thought on how to build for the future seems a bit backwards to me. Getting by with less is SOP for so many corporations since 2008, but at some point CapEx will have to pick up, because SG&A can only be sliced and diced for so long to help generate earnings.

Have a look at this chart, also from BI, courtesy of Soss at Credit Suisse. It displays the ratio of business fixed investments to corporate cash flows. You can see it is still at its lowest points over the last 50 years. Corporations just don’t want to spend their money on CapEx.

clip_image010

Now that squiggle-pic above just depicts what corporations are willing to spend from out of their own kitty. Despite all the access to cheap capital for the corporations to borrow in order to finance the future, there isn’t a pick-up in that area for CapEx either. Observe the following chart, additionally from BI, via Chandler at Brothers Brown Harriman.

clip_image012

Just look at that spread on the right side of the chart. It’s very telling of the current methods being utilized to generate further corporate earnings without the CapEx investment to build a solid foundation for future earnings growth. At some point soon though, that spread will begin to converge as the US should see genuine economic progress. Companies will actually begin to invest in their future as opposed to just provide shareholder value through buy-back’s and divvy’s.

This is very important, because even though CapEx doesn’t seem to matter right now, at some point it could be a key point in the inflation argument. The scenario has the potential to play out like this: economic growth picks up and so maybe the Fed moves rates up just a quarter percent or whatever. Banks get scared that their Fed window cash machine is going to go bye-bye so they increase lending across many facets of their operations. Companies begin borrowing the still cheap capital to invest in operations and hiring actually picks up. This begins the upward shift in money velocity which should then begin to push prices upward. This is a scenario that investors will want to keep their eyes on, because it has the potential to make you a lot of money as markets grow, but it could be the mask that covers the arrival of the next financial crisis. Because we all know, nobody ever sees the next financial crisis coming.

6. Sovereign debts and sovereign solvency are issues that are front and center and yet hidden in plain sight. The numbers are simply so huge that it’s as if nobody cares anymore. Central banks are able to keep rates at or near zero percent and gin up funding on demand, so everything is under control. Unfunded liabilities are on the back burner as massive liquidity continues to be mistaken for solvency. Developed nations around the world have debt levels that are between 1:1 to 2:1 of GDP and it doesn’t matter. Here’s what matters:

clip_image013

7. The old banking model is dead and has been dead since the repealing of Glass-Steagall but really even earlier than that with the creation of mortgage backed securities. The so popularly and prevalently quoted old banking model was the 3-6-3 of borrow at 3% – lend at 6% – be on the golf course at 3pm. Banking pretty much used to be that simple. That’s how it should be. Banks shouldn’t be systemically risky to the entire world economy. And if the regulators around the world were actually doing their job, then these SIFI’s wouldn’t be SIFI’s. Banks now simply take in as much capital as they can and use it as collateral across the spectrum of their “sophisticated” trading operations.

Why lend to entrepreneurs or businesses in need when you can lend to sovereigns and use that asset as collateral in additional transactions in an endless chain of profit generation. The widespread acceptance of the current banking model is truly a thing to behold. Have a look at a couple of countries from over in Europe who simply appear to be clueless. This chart from BI, via Commerz Bank, shows how the Italian and Spanish banks are simply reflating their balance sheets in an attempt to stay resuscitated for as long as possible before the ECB starts monetizing like they’ve promised. Unbelievably, the entities that need access the most to that capital to help grow each respective economy is barred from access as the banks maintain their favorability to “govie” holdings.

clip_image015

There has been so much debt created between the sovereigns and the SIFI’s and so many derivatives are traded underneath it all to keep the illusion of solvency alive that nobody knows what’s what anymore. In a previous post last June, I expounded fairly extensively on the derivatives rife throughout the banking system. Click the link and have a read if you’re inclined. The old banking model is dead and I suspect that even after the next crisis, the system still won’t be cleansed of the systemic risk of the new banking era. If and or when a serious dislocation arrives, I’ll hold out hope for real, positive change that creates a balanced financial platform from which the world of finance, investing, banking, and economics can work. I ain’t holding my breath.

8. I don’t want to go off the deep end of a rant here after sharing what I think I are some important notions to consider in understanding some concepts behind the macro economic and financial outlook, but a couple of comments on statesmanship and justice are warranted. Civic duty in the political arena appears to be as dead as the old banking model. It really seems as if the Boomer politicians with their 60’s era non-inhaling, non-conformity or 70’s era dancing in polyester have forgotten what it means to build and develop a nation. Even the the X’ers in positions of power are infected by the commercialism they were so subjected to as youth. Both groups who control US politics seem to be consumed with consolidating and maintaining a power base, as opposed to building a nation up and maintaining an image of America as a fair, free world power. Obviously, these statements are highly generalized and that’s all I gots to say about politics.

As for justice, where is it for the bankers? Where is it for the corrupt? I realize it’s a tired question, but it’s difficult to let go. When you hear responses from Eric Holder on a slew of subjects, you just want to puke…literally. A handful of traders take the fall for the Great Recession. No banking executives are indicted in America, but during the S&L crisis going into the 90’s, hundreds of banking of executives were incarcerated and indicted for their malfeasance. Look at Iceland’s accountability of the executives from their largest banks; convicted and sentenced already. Is Iceland, an island of 300,000 people, a model of financial reform that America should be closely following? Not necessarily. That’s not the point. The point is you have a sovereign nation that held those accountable who deserved to be held accountable in the banking system. Enough about that as well.

9. The last notion on the list of things that don’t matter is volatility in the equity markets. No need to go short or hedge as you can simply go long and outperform on an absolute basis. That’s what ample liquidity across the world does. It drives up certain asset prices, and stocks are the asset du jour to be driven up by current liquidity levels in the economy. Volatility is one of those funny things though, where it doesn’t matter until it does in a very big way.

It does appear as if now may be a dangerous time to enter new positions as things seem a bit frothy, but as the liquidity continues to flow and the volatility is non-existent, it may be more imprudent to not get positioned going into the new year. At this point, hoping for a correction just to get the absolute best price on new positions may prove to be unsound. But then again, so could diving into new positions just to potentially play catch-up. For now it does appear as if the economy may begin to mend, and when combined with liquidity levels, ZIRP, and the general trend, one has to position their portfolio accordingly.

In my next post, I’d like to share a simple portfolio that may be able to take advantage of the current trends while hedging some of the correction risk; in addition to taking a contrarian stance in some of the positions. If I don’t share another post this week, have a great holidays and happy new year. And thank you so, so much for taking the time to stop by my site and having a read.

Early to the Unattended Short Party Again

Just wanted to apologize for a lack of posting activity. For newer readers expecting a little more activity, it gets tough around the holidays with family demands and traveling. My goal going forward is to post at least twice a week, and at the very least, once a week. I know that’s not on par with your favorite daily reads, but I hope I can continue to potentially add value to your investment life.

The markets just keep running, even with this past week’s slight consolidation. Hell, Friday’s pop was enough to put the S&P 500 at basically even for the week, the Russell 2000 a touch off the highs for the year, the NASDAQ at post-2000 highs, and the DOW in the same position as the Russell at a touch off the highs. Some consolidation, huh? Previously, I reasoned that a correction was on the horizon and illustrated with some charts why I thought that a correction was imminent. The results…

WRONG! The markets have been looking like a small blow-off would occur since the summer. Those signals were all false though and chartists who have been attempting to short the market keep coming up just that…short. The lesson that you should not fight the Fed keeps getting firmly taught in 2013, as noted by the under-performance of hedge funds, shorts artists, and tape readers. None the less, have a look at the following set of charts from several weeks ago. In a normal world that’s not flooded with liquidity chasing up financial assets around the world, these charts would generally portend of a change in trend. However, this ain’t a normal world to be speculating in.

These charts depict several factors of risk taking and risk abating, which one would think would normally affect the greater markets. Divergences abound and yet the rising continues. Observe:

1. SentimentTrader displayed the Rydex family of funds’ 12 year low in assets allocated to their money market funds

clip_image002

2. The stock to bond ratio – one of SentimentTrader’s daily charts showing periods of over/under value in equities

clip_image004

3. S&P 500 to JNK (junk bond ETF) – notice the previous downturns in the S&P 500 earlier this year when JNK turned down

clip_image006

4. ZeroHedge provides a Bloomberg terminal snapshot of a nosedive in IWM shares outstanding while price remains stable

clip_image007

5. Here’s another junkbond relative performance chart. Apologies to the author. I forgot from which blog I nicked it.

clip_image009

6. Courtesy of DecisionPoint, going back to to 1999 one can see what a divergence from the PBI for the SPX generally means for the SPX

clip_image010

Alright, enough with the slide show. There are so many more squiggle pictures that chartists could call upon to attempt to prove that a downturn is imminent but why bother? Liquidity is not going to dry up. Interest rates aren’t going to spike up past 6% and send the planet into recession tomorrow. Based on the performance of equity markets and despite a ton of divergent indicators, I’m beginning to get the feeling that the markets may just consolidate in a semi-volatile sideways range. There’s a real possibility that the markets just bounce along up and down plus or minus 1% – 3% into the new year before resuming an advance.

We keep coming back to this now overly used quote from 2007 by Chuck Prince, former head of CitiBank: “As long as the music is playing, you’ve got to get up and dance. We’re still dancing.” This little gem has popped up almost everywhere in the financial blogosphere recently, so I figured I’d find a gratuitous reason to post it too as it is quite apropos. Good old Chucky “Cheese” Prince made this statement at the peak of the markets back in 2007 because he knew how unstable things were and yet he continued to allow the SIFI(systemically important financial institution) he ran to trade and underwrite garbage.

And while I’m at it, in case you don’t know what the co-crown prince of golden parachutes looks like; here’s his picture. Truly a face you can trust with managing hundreds of billions.

clip_image012(picture courtesy of:  Yamaguchi/ Bloomberg/BLOOMBERG NEWS)

For those ill-informed about Mr. Prince, he walked away from Citi with a cool $100M for overseeing the destruction of the bank. The reason he’s a co-crown prince of the golden parachute set is because he shares the crown with Stanley O’Neal, but I digress. We’re talking about the potential for a sideways consolidation in the market and not rehashing sour grapes on a who’s who behind the SIFI’s that have changed our world as we know it. As for speculative advice, well I have exited my short positions. I hedged my last move against the SPY and simply broke even. I’m currently taking a step back and allowing for the picture to clear up a little for a trader such as myself.

In my next post, I intend to touch on what matters and what doesn’t matter anymore in finance, investing, and economics. And there just may be a hint of informed sarcasm. As for speculating, if you are positioned long, stay long. Enjoy your paper profit ride, but don’t forget to mind your stops and make those profits real if needed. If you’re trading and miss the lack of real volatility, then now may be a good time to catch up on some insightful reads. Seriously, look at that picture up above one more time. Tell me that’s not exactly who my last post was describing. Cheers!

Perception Management

The number one skillset to possess, in a world where true merit, diligence, ethics (work and moral), and pure results are forgotten notions, is the ability to influence how others perceive you. I dare you to dispute it. Perception management also goes by:

“Politicking”

“Brown nosing”

“Boot shining”

The list goes on, but in your own endeavors, I would venture to say that you can instantly recall a specific hack(s) you used to work with or for. How did they obtain their position? Why do they keep advancing without truly accomplishing anything? How come they haven’t been demoted or fired? It can be quite maddening for the honest, ambitious employee who truly believes in a meritorious work environment. It’s not a concept that is exactly taught in business schools. No, schools teach about theory and principle; “And with a little hard work and diligent application of the theories and principles you have learned, you too will be successful.” Ha! Tell that to today’s early-career Millennials at the bottom rungs or the kids just exiting college and don’t see the most exciting prospects.

The name of the game is “you gotta get along to get along.” And that doesn’t just apply to the world of politics. It applies to any and all hierarchies. If you want to successfully rise within a hierarchy then you better master the concept of perception management. Or you can keep wondering why Johnny-Windbag keeps moving up the ranks even after sleeping with the wife of one of his subordinates and telling his vegan boss that he too is a vegan, when Johnny really spends his weekends clubbing baby rabbits and cooking them.

Universities don’t teach you how to treat your boss to drinks and weasel into their inner circle. Nor do they teach you how to effectively play all sides of superiors, subordinates, and colleagues without any conscious or semblance of empathy. In a business environment that appears to be filling with more and more successful psychopaths, sociopaths, and narcissists; maybe perception management should be added to the curriculums of business schools. Imagine?

You finally are accepted to Wharton and you are required to write a thesis on how to take credit for the specific work of a colleague while discrediting your boss to her boss so that she may be transferred departments. If it worked for Johnny-Windbag, who only has a lowly state degree, then why not get that B-school Master’s in Perception Management? Because eventually, if you don’t learn the game, you will plateau.

I really started to explore the notions of sociopathy, psychopathy, and narcissism in the work place only after experiencing it around every corner in one of my previous careers. One of the books I recommend, Snakes in Suits by Babiak and Hare, takes the reader through the mindset of a typical business sociopath and the opposing honest, ambitious hard worker. Back in 2011, Jesse from the Café Americain blog, wrote some great pieces touching on the mental sickness. You can read a sort of compendium of Jesse’s pieces on the subject matter here. I then started to evaluate, unprofessionally of course, former colleagues and superiors from my first career. The narcissism and psychopathy ran rampant in that culture and continues to this day.

Most psychopaths or sociopaths are not cold blooded killers or hard core criminals. In the workplace they’re just people inordinately motivated by a reward system and will generally execute any strategy they see fit to obtain rewards, despite any negative impact to fellow human beings. These people exist in your life right now…professionally and personally. They can sometimes be difficult to sniff out because the business-minded ones tend to be somewhat gregarious and skilled conversationalists. They can be genuine nice guys/gals to most people’s face and then stab them in the back for personal benefit at the opportune moment. The ability to dazzle you with their poppycock and malarkey allows them to sink their claws into you before deciding how best to proceed in the relationship. Always be on the lookout for these snakes.

To be fair, managing perceptions is a standard skillset that all persons operating within a corporation, partnership, or any hierarchy should possess. Wanting to put your best foot forward by having others perceive you well is a perfectly normal behavior. Obviously, I’m not referring to that normal sort of behavior in this discourse. And if you’re reading this and have worked anywhere where you desired a promotion, then you know exactly what kind of perception management this post is referring to.

It can be mentally and emotionally taxing working in an environment up against those psychological archetypes. I learned valuable lessons, though. I learned to appreciate and hold more dearly that which is truly important. I learned that the pursuit of your passions in lieu of a little salary in the short term, is decidedly more rewarding in all aspects in the long term.

Cue the un-smooth segue — in the markets, one can observe a prime-time game of perception management occurring in the hedge fund space with the “hedge fund hotels.” As it is, the thousands of excess, non-alpha adding hedge funds around the world get to charge 2 and 20 to under-perform the indices. Is that the new normal? It will be for the foreseeable future as central bank liquidity drives all risk assets up for the next couple of years, and knuckleheads of the 2 and 20 set try to outsmart a simple rising tide. Observe the following chart courtesy of HSBC’s Q3 hedge fund performance report via ZeroHedge:

clip_image002

Have a look at some of those names north of the S&P’s performance mark of 23.16% return through October. There are several OG’s. Caxton and Tudor. Additional giants include Pershing Square, Maverick, RenTec, Fortress, Brevan Howard, and the massive Millennium. These aren’t exactly the knuckleheads managing $40M. No disrespect to said knuckleheads for siphoning your $800K in fees and the cut for their skills. The list above represents gross fund assets in the hundreds of billions.

Where the career risk comes into play for fund managers is with the “hotel” stocks via the broker network, various grapevines, and 13F’s. Have to be in what Tepper says. Wait, what’s Einhorn buying? Get our damn trader on the line and tell him to average into whatever Dalio’s biggest holding is currently. Icahn bought $2.5B of what?! Now those are gross exaggerations for sure but have a look at this chart of the 50 stocks with the largest number of hedge fund investors through Q2, courtesy of Goldman Sachs Research via ZeroHedge. It shows just how much copycatting truly occurs in the industry and maybe provides just a portion of the explanation as to why so many funds continue to consistently under-perform.

clip_image004

Piggybacking may be one way to consistently generate alpha, but that justifies 2% of assets or even more in some cases? Please. Anyone with the guts and smarts to just hold through this liquidity fiesta could have easily outperformed virtually every hedge fund on the planet year to date. Take a gander at the following snapshot of 2013 YTD returns in some of the popular 3X levered ETF’s, courtesy of ETFreplay.com:

clip_image005

It should go without saying but hindsight is 20/20, as I don’t think the world of speculators saw 117% absolute return just buying and holding a 3X levered RUT product. And I will readily admit that despite how easily money could have been made in 2013 by simply holding a handful of indices, I’ve whipsawed myself in and out of profit this year with various option strategies.

As for the “hedge fund hotels,” well we all saw what happened to Apple. Its parabolic spike came right back down into value territory, which is why it continues to be so widely held. Reasonable multiples to free cash flow in the biggest cash generator in the market will spark the interest of any value investor. Google may also see some downside action in the near future, but I’m not willing to currently bet against a behemoth that pumps out behemoth proportions of innovation and free cash flow. Betting against AIG is like directly betting against the government’s own equity speculation. Like Google, it could potentially work but I don’t want to currently go there either.

Beware of investing on the behalf of how others will perceive you. It could be hazardous to your financial self. As for career benefits, well by all means, manage perceptions till you’re blue in the face. How else are you going to get that edge over Johnny-Windbag to increase your discretionary income and improve your lot in life? Through merit? If you genuinely believe that, then you may want to scroll back to the top and have another read.

Are We Gonna Get a Correction or What?!!!

I have called for a 10% to 15% correction since July 30th. Instead, all we’ve seen are back to back 5% corrections. Maybe I can just add them together and claim omniscience. This market just keeps climbing and climbing. BTATFH? It would seem that is the obvious trade du jour, but I just can’t bring myself to not bet against the momentum. My gut tells me to go short. And hell, since I’ve followed tea leaves and chicken bones before why not follow my gut, too. Speculating on your gut is not exactly a profitable path so we’ll get back to a couple of pieces of evidence in support of a short on the S&P 500, in a moment.

One thing that I think is important to consider when looking for a contrarian stance or to front-run the broader market, is to observe anecdotal evidence. It’s good to just read around the investment universe of websites and try to maybe obtain the aggregate stance. Unfortunately, one’s thoughts are already biased towards a certain action and this is where it is doubly important to consider the source of the opinion. Here’s a stance that raised my radar. Bespoke performed a study and shared the following chart with the market:

clip_image002

This chart was then shared by Jon Markman and Louis Basenese in separate articles days later. Essentially, they stated the markets have plenty of room to potentially run and can run higher than you may think. That’s reasonable on the surface and I agree that this market has plenty of room to run in light of the oceans of liquidity flooding across the earth.

But a 10% to 15% potential correction within a bull just won’t stop nagging at me. For good measure, Bespoke also posted this chart which leads speculators to believe a trend change may be upon us. Doesn’t that last candle look a touch toppy?

clip_image003

And then there’s the kings of anecdotal, the newsletter writers. The Investor’s Intelligence survey, as a contrarian signal, is leading us to believe that a corrective move may be in the cards for the markets. Observe the following chart, courtesy of SentimentTrader.com.

clip_image004

It shows that a Bull Ratio of 69% or higher is the Mendoza line for this indicator and the last 3 times this number was breached, a correction followed shortly thereafter; including the big one of 2008. As I’ve stated in numerous previous posts, I don’t think a giant crash is in order. Just a let off of some steam and the soiling of some trader’s pants.

Well charts are all well and nice, but I also like to review what some of the top value oriented managers in the game are doing with their cash. Are they building cash levels or allocating to new positions? Cash level buildup by the trusted brains in the value space of asset management is another solid indicator that something may be up. Bloomberg recently ran an article covering that exact notion. Below are some key excerpts from the article sharing the actions and thoughts of money managers such as Yacktman, Weitz, and De Vaulx.

From Bloomberg:
“It’s more fun to be finding great new ideas,” Weitz, whose $1.1 billion Weitz Value Fund (WVALX) had 29 percent of assets in cash and Treasury bills as of Sept. 30, said in a telephone interview from Omaha, Nebraska. “But we take what the market gives us, and right now it is not giving us anything.”

Weitz, whose cash allocation is close to the highest it’s been in his three-decade career, joins peers Donald Yacktman and Charles de Vaulx in calling bargains elusive with stocks near record highs. They’re willing to sacrifice top performance for the safety of cash as stocks rally for a fourth year in five.

“We will need prices to be down 15 to 20 percent for us to put most of our cash to work,” De Vaulx, co-manager of the $9.2 billion IVA Worldwide Fund (IVWAX), said in a telephone interview from New York, where International Value Advisers LLC is based. The fund, which outperformed 54 percent of competitors in the past five years, had 31 percent of assets in cash and equivalents as of Sept. 30, according to its website.

-Yacktman, 72, president of Austin, Texas-based Yacktman Asset Management Co…whose cash level rose to 21 percent as of Sept. 30 from 1.4 percent at the end of 2008, bested 92 percent of competitors in the past five years. “We are having a more difficult time finding bargains,” Yacktman said in an e-mail.

MarginRich here – Seth Klarman of Baupost has raised his cash levels to over 30% when he normally keeps the fund’s level at around 20%. Additionally, he’s planning on returning several billion dollars back to investors at the end of the year, as bargains are scarce.

Steve Romick, of FPA and their $14B in AUM, shared similar thoughts in the FPA Capital Q3 letter to investors:

In a normal year, and clearly this is not a normal year, we would expect to add four or five new companies to the portfolio. Hence, our antenna remains acutely tuned to capture any signal that alerts us to highly attractive investment opportunities, but our equipment is mostly picking up the noise of bull hoofs rampaging wildly as Ben Bernanke pours endless liquidity into the capital market. Speaking of Mr. Bernanke and the Federal Reserve, we would immensely appreciate it if he and his cohorts would explain to the American people what would happen if the Fed stopped buying $85 billion worth of Treasury and mortgage securities every month. Does the Fed believe the U.S. economy would collapse sending all of us into the poorhouse? Do they think the stock market would nosedive and wipeout trillions of dollars of wealth? Do they think interest rates will rise substantially and by enough to snuff out the recovering residential real estate market? If the answer is yes to any or all of the above, then our economic foundation is shakier than many might believe…We continued to take advantage of strong upward momentum in the market place and trimmed a number of positions. When the market is trading at rich multiples, we trim or sell our positions. Currently, the market is expensive so we have more cash than usual. We are absolute value managers so we will stay on the sidelines as long as it takes and husband our cash until excellent investment opportunities become available. On the other hand, we will quickly deploy capital into investments if they are attractive – like we have done on three separate occasions this year.

You get the point. There’s a significant amount of compelling anecdotal evidence, but let’s get back to the charts. I was reading an article last week from Stansberry Research, by their in-house trading expert, Jeff Clark. In the piece, Clark extolled the virtues of the NYSE McClellan Oscillator (NYMO) as a timing indicator for this year. I decided to go back a couple more years and gauge the NYMO’s timing ability to the S&P 500. The correlation is quite robust. Observe the following charts of the NYMO and the S&P 500 going back to 2011.

clip_image005

Since November of 2010, almost every time the NYMO hits 60, as denoted by the green line, then the subsequent gap down marked the beginning of a correction. It did not work on July 9th, 2012 and it wasn’t worth using on September 6th, 2011. Still, this indicator could have been traded profitably on the short side in 8 of the last 9 occurrences…and this week marks the 9th occurrence. Are you ready to go short?

clip_image006

I know, I know. Don’t fight the Fed. Don’t fight the trend. Don’t fight the market. I know all these things, and yet like a moth attracted to a light, I just can’t resist the potential of front running a corrective move. I know that waiting for a trend change is the prudent move, but the volatility has consistently swung so quickly this year and whipsawed so violently in some cases, that a hedged trade with a disciplined stop just may be the right move.

Another indicator that should be making traders at least stop and consider is the CBOE SKEW. Over at his Acting Man blog, Pater Tenebraum shared some insightful commentary regarding the option-based indicator that has a knack for front-running the VIX. From the article:

One of our readers pointed out to us last week that the recent strong rise in the so-called CBOE SKEW index should also be counted among the various divergences that make the stock market’s current advance suspect. Skew  measures the perceived tail risk of the market via the pricing of out-of-the-money options. Generally, a rise in skew indicates that ‘crash protection’ is in demand among institutional investors (institutional/professional investors are the biggest traders in SPX options). The basic idea is similar to the CSFB ‘fear index’ or the Ansbacher index (which compares the premiums paid on equidistant calls and puts). A unusual move in the skew index (which historically oscillates approximately between a value of 100 and 150) is especially interesting when it diverges strongly from the VIX, which measures at the money and close to the money front month SPX option premiums. Basically what a ‘low VIX/high skew’ combination is saying is: ‘the market overall is complacent, but big investors perceive far more tail risk than usually’ (it is exactly the other way around when the VIX is high and SKEW is low). In other words, a surprising increase in realized volatility may not be too far away. Below is a chart showing the current SKEW/VIX combination.

clip_image008

MarginRich here again – It should also be noted that 135 is the sort of magic number for the SKEW. Generally once that level is breached, then the potential for some action really heats up. So if you agree with what you have read here today, then the only question is how to structure a trade. There’s the old straight short of the SPY. You could sell some Calls and fund a Puts purchase. Or who says you have to specifically trade the information? Maybe you decide to take some risk off of the table.

Above all else, I recognize that the analysis could just as easily be nullified instead of confirmed, which would simply make this article entertaining(or annoying) and me wrong once again. If the index continues to set more all-time highs and breakout to another stratosphere, then the analysis is negated. None the less, with full disclosure, I intend to structure a trade off of this data.