An interesting article was posted at ZeroHedge today regarding the rally in the stock indexes and how short covering is continuing to drive a fair chunk of results. Any number of reasons can be attributed to this piece of information including the usual suspects of HFT’s algo’ing shorts from their money to the Fed is supporting equity prices to other central banks are buying US stocks. Causations and correlations are always a funny business, but the graph does paint a unique picture. The chart is the performance of the most shorted stocks over the last 6 months compared to the Russell 2000.
You can catch the entire article(it’s very short) here.
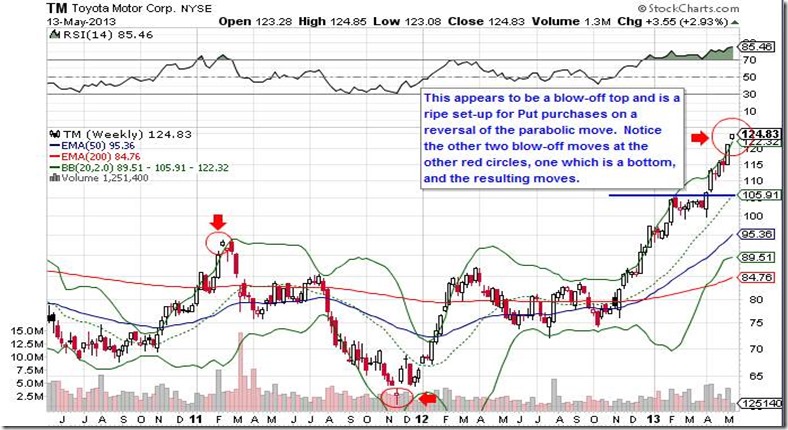
That being said, if you’ve gotta a steel pair or are as dumb as I am, the following chart of Toyota presents what appears to be a good opportunity for a very short-term swing trade to go short. I feel that Toyota is going to inevitably take out it’s all-time highs set back when everything else was at all-time highs, 2007, as the Japan trade still has room for a longer term melt-up. For now though, momentum appears to be arresting in a final move before the let off of some steam. Observe…
Toyota appears to be forming a weekly blow-off top. As the caption notes, look what occurred the other two times a blow-off move occurred on a weekly chart. These moves occurred what now feels like 3 decades ago as far as trading action goes. If the trading gods allow a normal move to occur as it would have in the old days, then Toyota should correct off of this move; potentially down to between $105 and $100 over the coming weeks or next couple months. I placed that blue line under the caption to denote what should be a fairly strong support point under normal technical analysis. I already made one attempt at this trade but was stopped out today. I will be trying it again on the July $105 Puts. Of course there is always the risk of a false signal as nobody is allowed to short the markets right now. Take a gander at this chart below from the Price Action Lab, a great site for the aspiring quant. Notice at the red circle what appears to be a blow-off top in the tech ETF, QQQ. Making that same trade of purchasing Puts would’ve have easily stopped out an options trader going short in quick fashion.
I point this out not to show that I’m scared to play the potential move in TM but to simply reiterate that it is a dangerous, dangerous time for one to fashion themselves a trader without the technological and potentially statistical tools that the biggest and most successful players are currently using. The best way to play the TM “blow-off top” is to wait for a breakout to the downside for confirmation of the trend-break and then quickly position in the option. Front running the move can yield upwards of 100% gains, which seems sexy until you’re stopped out. Waiting for confirmation takes your ROI of the trade down significantly but it’s tough to piss and moan about only making 30% – 50% in less than 4 weeks. I made the exact same play in XLU(utilities ETF) for a quick 45% in 3 days. Of course, that now makes me 2 for 6 going short in 2013 which ain’t exactly my best work.
Keep in mind I’m just laying out a basic Put purchase position. I’m not going to delve into complicated options strategies and start laying out straddles, strangles, condors, crosses, hippos, and moosesses. That’s for the reader to engage in. I’ll generally just throw out my interpretation of a chart’s potential and possibly a simple Call or Put purchase. What’d you expect? The site’s free.
Read, Read, and Read some more. Good luck out there.


One comment