Cycles, cycles everywhere…

Sadly, I don’t have any original content with which to dazzle your investment senses with for this post. I just want to share some noteworthy work on cycles.

I was reviewing a couple of interesting charts this weekend, posted by Greg Schnell – The Canadian Technician. The two charts depict some consistent highs and lows across multi-week cycles. Chart number 1 breaks down the last 15 years of the S&P 500 within 66 week increments.

clip_image002

Here’s Mr. Schnell’s comments regarding the chart:

What has made the recent market cycles (last 15 years) so interesting, has been the difference in time spans. From the 2000 high to the 2002 low was a period of two 66 week time spans. From the 2007 top to the 2009 lows was 1 time span of roughly 66 weeks. Why 66 weeks? Well, it is only through the manipulation and experimentation of the cycle tool in Stockcharts that I was able to find a time span that worked for all the market turns. While multiples of 66 weeks like 132,198 and 264 work well, they all missed one of the turns. It was only the lowest common denominator that worked. This is trial and error, best fitting with the historical models.

You can see it worked pretty well on most cycle lines. It missed in 2001 at the blue arrow. What is most important, is the right edge of the chart. It is telling us that we are near one of those potential reversal points that George Lindsay talked about. Only the history books will tell us how it works out, but it is worth noting in a timely manner.

Upon publishing that chart, Schnell received a chart from a reader of his blog. This chart goes back even farther and utilizes a 346 week cycle, as denoted by the orange lines. Chart number 2 was sent into The Canadian Technician by Richard Rhodes of Rhodes Capital Management. The chart is equally compelling due to the uncanny ability to mark major highs.

clip_image004

Keep in mind, as Schnell admitted, these charts are “best-fitted” so to speak. So like every other chart you may look at to gauge potential direction, you have to take the information with a large grain of salt.

Can’t post on cycles without touching on The Election Cycle. Chris Puplava, at FinancialSense, shared a couple of interesting charts. The first one he posted, courtesy of Ned Davis Research, is based on the geometric mean from 1929 through 2009. We’re roughly at the blue arrow in the mid-term year.

clip_image006

If the Election Cycle holds to pattern then we could potentially top out in the early spring, bottom out in the late summer, and begin the vaunted run-up of the pre-election year in the Election Cycle. That potential run is demarcated by the black box. Puplava put together a chart over the last 5 mid-term election years that correlates nicely with the previous chart, stating that, “The chart below is an average of the last 5 mid-term election years, excluding 2002 (I’m not anticipating a bear market this year), overlaid by the S&P 500 so far this year. The pattern suggests a rally of 6.5% into an April peak before giving back all of its gains, followed by a bottom in late August, to finish up with a strong year-end rally.”

clip_image008

Why would I share two charts that seem to conflict with each other? Because I want to continue to communicate that one must be very careful how they interpret the squiggles. It’s doubtful we’re at a major top, but those first two charts make you stop and think for just a moment. On the other hand, the Election Cycle is real, well known, and has been expounded on by countless hordes of technicians. If a gun were put to my head to decide how to invest going forward just based on these sets of charts, I would definitely follow the Election Cycle.

The ongoing point across a great deal of my posts is that these are not normal times to be speculating. Thus, an extra measure of care has to be taken before running off and allocating capital based off of some macro-themed charts. For readers who don’t think that these are unique times to be an investor, then have a read of some excerpts from Seth Klarman’s latest letter to Baupost Group investors. It comes courtesy of ZeroHedge, and in it, Klarman shares his own thoughts that probably mirror many of your own regarding this Twilight Zone environment.

I’ve shared Seth’s credentials a million times already but if this is your first time here and you are unfamiliar with Mr. Klarman, then he’s the founder of the Baupost Group hedge fund. He manages approximately $22 billion. He’s a notorious value investor whose skills are in a class with the best. Last year alone, he returned $4 billion to investors because he didn’t find enough compelling investment opportunities and the fund’s size may have been getting a touch unwieldy. He’s a legend, so the commentary shared in his letters is worth heeding.

The volatility that has returned to the markets this year has been a thing of beauty. I know the traders of the world have enjoyed it. Well keep calm and carry on the fight to enhance your own personal wealth effect.

To invest the emergency fund, or not, that is the question

I wanted to veer away from the normal subject matter and touch a little bit on personal finance. We’re going to visit the concept of the emergency fund(“e-fund”). It’s a subject that’s made some heavy rounds in the financial news sites and blogosphere to start 2014, but the subject of e-funds gets expounded on annually in countless articles.

Marketwatch ran an article on how to retire early. The piece was focused on Mr. Money Moustache and his methods of living well with less. One of the personal policies he espouses was that there’s not really a need to maintain an e-fund. It’s not that he doesn’t believe in them, just that an e-fund is probably best for a specific demographic. Here’s what he stated in the article:

Yeah, I’ve always questioned the idea of an emergency fund. It’s a great tool for the financial beginner who lives from paycheck to paycheck, and for whom a broken water heater would make the difference between making ends meet and borrowing via a credit card. But once you get off the ground, your credit card is a monthly buffer and your investment accounts are the emergency fund.

So I have no savings account at all, and keep just a few thousand dollars in the checking account. If a huge unexpected expense ever came up that was greater than my income, I would put it on the credit card along with all other monthly spending. Then just sell some shares of an index fund and transfer that back to the bank before the credit-card automatic payment happened at the end of the month. And I’ve still never had to run a credit-card balance in my life.

The great part is that if your spending is much lower than your income, these emergencies become very rare, because there is always a surplus, which you have to sweep away into investments each month. So if the water heater dies, you buy a new one and just invest a little bit less that month.

Maintaining access to adequate amounts of liquidity when a true need arises is simply a matter of prudence. The rich may not call it their “emergency fund” per se, but they tend to keep enough cash on hand or maintain easy access when they need it. The middle class are generally fastidious about maintaining an e-fund despite the level of job security or adequate assets already accumulated. The less fortunate, and those just starting out in the game of asset accumulation, are simply looking to scrape together what they can so they have something squirreled away for a genuine unexpected need.

Everyone has to assess their own total financial situation and determine what is the best mix for their e-fund. Is it all cash? Is it all investments and play the statistical odds game against Murphy’ Law that the markets won’t be in the middle of a serious dislocation at the exact time you need to liquidate? Is an e-fund even needed?

Suze Orman and Dave Ramsey, the personal finance gurus for the Great Unwashed, have two decidedly different takes on the e-fund but both believe in the concept. Orman believes that 8 months of expenses should be covered with the emergency fund, and that one should forsake making more than minimum payments on any credit card debt in order to build up that surplus. Ramsey believes in building up $1,000 ASAP for emergency purposes and then paying off all non-mortgage debt i.e. revolving credit, auto loans, and student loans by utilizing the debt-snowball method. Then once those debts are paid, begin building an e-fund to cover 3 to 6 months’ worth of expenses.

The one glaring consistency across Orman, Ramsey, and the countless other commentators is the total lack of imagination in how to allocate the e-fund. Here’s the same list of financial instruments shared ad nauseum across the web: online savings account, CD’s, laddered CD’s, money market, T-bonds, or I-bonds. If one truly wants a “risk free” tool for safe interest accrual then these are of course adequate options, but you still have penalty risk with the CD’s and bonds. The problem is that these instruments yield virtually nothing. Thank you ZIRP.

I’m a proponent of part cash/part investing. If you’re going to maintain a sizeable e-fund, which is of course a relative term, then there are several tools available that offer vastly superior yield without the pure risk of stocks. I didn’t say zero risk; just not pure stock market risk. I’m talking about closed-end funds(“CEF’s”) in the income sectors. Specifically, I’m talking about investing in CEF’s that hold preferred securities, muni-bonds, and energy-related MLP’s.

CEF’s can be a good addition to an e-fund because they easily provide yields over 5% and can often sell at a discount to net asset value(“NAV”). Meaning, the total market capitalization of the closed end fund will trade for less than the total market capitalization of the investments the fund holds. It is not unusual to be able to enter a position into a CEF for $0.90 on the dollar. Stated another way, if Make-Believe fund’s NAV is $10 a share, then the market may place a value on the share at $9. This discount may occur for any number of reasons. Circumstances are different for each fund. The most obvious reason is sentiment in the primary asset class of a CEF’s holdings.

My current 3 favorite CEF’s for partial e-funding are tickers: JPS, NEA, and KYE. I’ll get to some details on each in a moment. I want to share a site first.

If you’re one of my readers who is un-initiated in the world of closed end funds, then stop by CEFConnect.com. There you can find most everything you need to explore the world of CEF’s and link to the sites of each asset manager to obtain even more detail about a fund you may be interested in. It’s a comprehensive site that provides news, education, interviews, a screener and more. In fact, here’s a snapshot of the screening page I used to pare down my own list of CEF’s.

clip_image002

The screener is easily customizable to winnow down the list of hundreds of CEF’s. From the pic above, you can see that my screen utilized a 5% minimum distribution rate, which is the CEF equivalent to yield for you stock dividend and bond coupon junkies. I also screened by discount to NAV and Market Cap to ensure that only funds that traded at a discount and with adequate liquidity would be filtered. The list was narrowed down to 66 closed end funds. I knew what sectors I wanted to choose from, so then it was a matter of assessing discounts to NAV, yields, and market caps to make final selections.

The Nuveen name is well known in the CEF space and has a long, rich history operating as a financial institution since 1898. Nuveen possesses total assets under management of $215 billion. Visit Nuveen for additional details about the company and its selection of CEF’s.

I like preferred stocks because they’re highly liquid, trade like common stocks, and in a lot of situations can yield income as steady as a bond. Preferred stocks provide no voting rights to shareholders but they are farther up the food chain in the event of a bankruptcy. Preferred stocks generally trade at a par price of $25 and tend not to get too far above or below that except in times of serious economic strain. Municipal bonds are tax free and appear to have a great deal of the fear in the sector already baked into the price. Lastly, the energy-related MLP’s allow for the upside potential of energy production increases across the world by investing in the companies that provide energy transport via pipelines and ship containers. These companies are the “toll booth” operators of energy transport and their consistently assured business allows outstanding cash flows from these master limited partnerships. Additionally, these three are not the most strongly correlated assets across the income space which provides a small margin of safety.

JPS is a Nuveen offering that specializes in preferred securities. Why bother with the hassle of researching which credit worthy securities to allocate your funds in when you can have the experts at Nuveen take care of you. JPS offers a juicy 8% yield paid in monthly distributions of 5.5 cents each, and the current discount to the NAV is 11%. So you’d be paying $0.89 for $1.00 worth of assets.

NEA is another Nuveen offering, but it specializes in municipal bonds. Municipal bonds are tax free instruments so they’re probably best utilized in a taxable account, but I’m no CPA or tax attorney so please consult an expert for advice on your specific situation. And remember, the securities described in this post are not a specific recommendation to the reader. They are simply an offering of my preference in how to semi-allocate an emergency fund. Muni-bonds were oversold in 2013 and some fear of muni-bonds may be well founded. Cities in California were going bankrupt. Detroit is Detroit. Puerto Rico is freaking out fixed income investors, but all these fears have now been discounted into the sector. Hopefully, fully discounted. If you recall in my last post, in the last 20 years muni’s have always bounced back to gain at least 10% after a down year.

Plus, NEA trades at a 8% discount to its NAV. The best part of this instrument is that while it yields a lovely 6.4% at last close as of this writing, the yield is tax free. So if you’re in the highest tax bracket of 39.6%, that’s a taxable equivalent yield of 10.6%. A double digit yield is not easy to come by these days and here you have a tool that allows you to earn that yield at a discount. Your taxable equivalent yield is calculated by taking the fund’s current distribution yield and dividing it by 1 minus your tax rate.

Example: 6.38/(1 – .25) = 8.5%

The last fund is KYE, which technically invests across a broad range of energy related assets and not just MLP’s, but I just generalize it as an energy-MLP specialist. KYE offers a yield of over 7% and trades at a discount of 9% to the NAV. So again, you’re only paying $0.91 for a $1.00 worth of assets. The fund has positions in companies such as Kinder Morgan, Williams, ONEOK, Plains All American, and Teekay; which are all heavyweights in their respective fields. If you believe in the growth of America’s energy production and potential for energy export while also believing in the potential growth of worldwide demand for energy, then KYE appears to be a conservative bet on that growth while also being paid to watch if the thesis is correct. Kayne Anderson is not a typical mass market asset manager. I guess you could consider them a little more boutique in their operations, but $25 billion in total AUM is certainly nothing to sneeze at. They’ve been around for 30 years now and have a focus on energy, muni’s, private equity, and mezzanine level credit opportunities. Learn more at KayneCapital.com.

So here’s the point in the article where you think to yourself, “Yeah thanks for the recommendations but how did these investments stack up during the financial crises?” Like I said, no risk can be eliminated; only mitigated. That’s why it’s called investing aka speculating. In 2008 – 2009, every asset on the planet lost value. These 3 offerings recovered surprisingly well, especially NEA and KYE. They fell hard but bounced back fairly quickly into their pre-crisis trading ranges. JPS fared worse as it has yet to even touch its inception per share price of $15. However it has risen 150% off of the lows, all while yielding over 7% like clockwork. Observe the following trio of charts courtesy of CEFConnect.

Preferreds
clip_image003

Although again, it has not recovered its pre-crash pricing, JPS bounced up to over $8 a share in fairly short order and has maintained a fairly tight range between $8 and $10 a share. With the NAV discount, this looks like a good window for allocation.

Muni’s
clip_image004

NEA recovered to new all-time highs in 2012, but then a couple of California cities, a Motor City, and a certain salsa dancing island later has brought the fund back down to 2009 levels. The baked in fear and NAV discount present a compelling opportunity for appreciation and yield.

Energy Transport
clip_image005

KYE has performed the most consistently before and after the last financial crisis, trading in a tight range between $25 and $30 a share. Pre-crisis, the fund primarily traded at a discount. Post-crisis, it has traded primarily at a premium. Now, despite all the energy being discovered, drilled, and pumped in America in addition to the ZIRP environment, KYE again trades at a discount towards the lower end of the price range.

These charts show that there are obvious risks in making an investment. One can’t just allocate some cash to these securities and then forget them like they’re a savings account. These are uncertain times to be investing and you have to be vigilant in constantly assessing the risks of an allocation. The largest risk associated with these funds is interest rate risk. In a Zero-Interest-Rate-Policy environment, these funds can be affected if rates begin to rise. KYE would be less affected than JPS which would be less affected than NEA, which is partly why I have chosen the three holdings, but a rising rate environment would have a negative effect.

Fortunately, the widely-known fact that the Federal Reserve wants to maintain ZIRP through 2015 provides at least a 2 year window to take advantage with these 3 closed-end funds. But facts and circumstances can change, and so accordingly, decisions about how funds are allocated must adapt. A couple of ways to help mitigate some of the risks is to use trailing stops as well as look at how far a potential premium builds. If the premium builds too far, say 5% to 10% over NAV, then taking profits may be a good idea. Even accounting for frictional costs, it may be worth earning the capital gain. The resultant cash can then be placed in a different fund, maybe in the same family, that is a reasonable facsimile from a holdings and performance standpoint. Or, you can park the cash in savings again and simply wait for the premium to abate, which by reviewing the charts up above, happens quite often.

Lastly, we’ll visit the fee structure. Professional expertise along with the provided infrastructure has to be paid for and these CEF’s are no different than any other mutual fund or ETF. At first glance, the fees and expenses appear outrageous but only to an ETF-addict who doesn’t understand what they’re getting for their money. The table below summarizes the management fees and expenses for the 3 funds:

Fund Family Ticker Management Fee Other Expenses Interest Expense Total
Nuveen JPS 1.17% 0.07% 0.47% 1.71%
Nuveen NEA 0.90% 0.09% 0.83% 1.82%
Kayne Anderson KYE 1.83% 0.91% 1.64% 4.38%

Now don’t get scared away by those numbers just yet and go running for cover under the low-fee Vanguard umbrella. Keep in mind these fees and expenses are taken from operational profits of the funds. After the fund accounts for these 3 operational expenses, then available cash flows are distributed to shareholders. So despite those fees and expenses, shareholders earn a yield of over 7% in JPS and KYE while NEA provides a taxable equivalent yield of between 8% to 10%. Last time I checked the Vanguard ETF’s, even with their incredible fee structure, there are zero ETF’s that yield over 5%. The universe for financial products is wide and vast; presenting workable solutions for everybody.

Assess your own situation. Determine the best course of action for you or your family and make a decision regarding an emergency fund. But now instead of simply reading about the same old non-yielding(but relatively safe) bank tools everyone has at their disposal, you have some high-yielding options that provide a small margin of safety. Remember, if you’re unsure, seek the advice of a professional and always be sure to conduct your own due diligence.

A Few Sample ETF Portfolios to Watch

Well 2014 has arrived with a tepid start and already the correction bells are ringing around the financial web. I’m as guilty as the next blogger of trying to front-run corrective moves in the greater markets, but in my experience, it’s rare to see a pack of pundits predicting market direction with collective accuracy. Sure, equities look a touch expensive here depending on which valuation-gauges you’re utilizing, but financial writers around the web(myself included) have been calling for corrections since the last one of note in June. Additionally, I’ve read plenty of analysts who state there’s still value at these stock prices.

Let’s consult the tea leaves and see what they communicate:

clip_image002

As the squiggle shows, if this weak start to the year is the genuine beginning to a sizeable(but perfectly healthy) correction of at least 8%, then there will be plenty of time to get properly positioned to take advantage going in and coming out. Notice at the blue circles above, how long the market takes to actually set-up the real dip that shakes things up.

Last year was the Year of the Passive ETF. The year 2013 caught the hedge fund industry with its pants down and the rich, whose funds were locked into 2&20, drastically under-performed the plain old, vanilla ETF of SPY. The S&P 500 tracker returned 29% last year, beating it’s very long term CAGR by a very healthy premium. In a mad trading world of short-term thinking and instant gratification, the long-term view of the Bogleheads destroyed churning traders on an absolute basis. Will 2014 be more of the same? I wouldn’t bet on it, but the consensus view out there seems to be that 2014 will be another good year…just not as good as 2013. Some more consensus thinking has been, “We’ll probably finish the year with the stock markets up about 14% to 16% compared to the prior year’s 30%’s for some indices.”

So in the spirit of following what worked last year while trying to include a touch of the contrarian and a dash of new trends, I’ve put together an ETF portfolio that I’d like to track in 2014. Because chasing always works! As always, this is not an investment recommendation. Since buy & hold was an elite strategy for 2013, and really since 2009 apparently, let’s see if 2014 continues to favor buy & hold with good fortune.

We’ll title the portfolio, Look Back and Ahead. Here’s a snapshot of its construction using ETFreplay.com:

clip_image003

Let it be acknowledged that this portfolio is only partially constructed using a rear-view mirror, and that investing with one’s view on the rear-view mirror is generally not going to lead to short-term success. The Look Back & Ahead (“LB&A”) portfolio was constructed for short-term results in 2014 only and is looking to utilize prevailing trends and combine them with some of the strategies that had a rough 2013. Eight of the chosen ETF’s follow trends established in 2013. These are Japan(DXJ), Junk Bonds(HYG), Biotech(IBB), Russell 2000(IWM), Tech(QQQ), Share buy-backs and dividends in earnings growth(SYLD), Consumer Discretionary(VCR), and Health Care(VHT).

The remaining 4 ETF’s of LB&A are the contrarian plays that could bounce back in 2014. Some of the possible reasons behind any potential bounce-backs are: extended negative sentiment ready for a turn, value at these prices, or hot money moves in together creating a new trend. The 4 trends waiting for a potential 2014 rally off some lows are: Emerging Markets(DEM), Europe(FEZ), Gold(GLD), and Muni-bonds(TFI).

You might be thinking muni’s and saying to yourself, “Really?” They’ve had a tough year for sure. Certainly one of the worst performing years in the sector over the last 20. Barclays produced a chart of performance for the past couple of decades. It shows that after a down year, the sector tends to rally quite nicely. Will this time be different?

clip_image005

Since the S&P 500 index performed so well, we’ll track LB&A against the SPY for the year. But wait, there’s more. If I think that LB&A may be able to outperform the market by riding some established sector trends and a handful of potential counter trends, then why not leverage up. Well I have a portfolio for that too, that allows for a 2 or 3 times leveraged move in each of the sectors of LB&A without taking on margin risk into your investment account. Observe:

clip_image006

Unfortunately, ETFreplay subscriptions do not provide access to the entire universe of ETF’s. As they state on their website, “As of 2010, less than 500 ETFs have provided >98% of the trading ETF/ETN volume in the U.S. market.” Which means that due to a lack of liquidity and volume, six of the levered plays are not in the ETFreplay database. As such, I am unable to easily save and track the portfolio with their site’s tools. I’ll just save it on another site’s portfolio tools and drum up some charts in Excel for performance tracking purposes. And in the continued spirit of simple benchmarking against the S&P 500, we’ll use SSO(2x levered S&P ETF) as our comparison benchmark.

Just for ha-ha’s, we’ll track another portfolio in 2014 of purely contrarian plays. Construction of this portfolio should be obvious to most, but have a look at its make-up. It’s titled Contrarian New Year.

clip_image007

Obviously, the BRI of BRIC had a tough year so we’re allocating there for total country exposure. I also included Singapore but left out Turkey. With the ongoing corruption scandal in Erdogan’s government, there’s obviously a whole lot more than sentiment going on there. We’ll just see how that situation plays out and how it affects investor sentiment towards the Turkey ETF later in the year. Commodities were utterly atrocious, so I included DBC and GUNR but also wanted to concentrate performance for some mean reversion specifically in coffee, corn, aluminum, coal, and silver. Gold miners were…well you know the story by now. Utilities was one of the worst performing sectors in the US along with TIPS, as nobody expects inflation and everybody wants to buy growth. We’ll see if inflation starts to tick upward and relative value attracts some players back into the utility space in 2014.

Just like muni bonds up above, you may be thinking that the gold miners prove I’m a glutton for punishment. That may very well be, but risk can always be managed, and if the underlying product has a bounce-back year then the producers may see a little pop in performance. Especially if the metal can catch a bid sufficiently past most of the producers’ all-in-sustaining costs. Observe the following chart of the XAU’s performance over the last 30 years, courtesy of US Global investors via Bloomberg. It says to me that miners have a potential low risk/high reward set-up. Believe me, any time the word gold comes out of my mouth, I want to shoot myself in the face.

clip_image009

Remember, that these sample ETF portfolios are not investment recommendations and I reserve the right to allocate my own funds as I see fit into or out of any of the fore mentioned investment products. If you’re interested in some of the more professional portfolio metrics and want backtest results, Sharpe ratios, alpha and beta, correlations, etc., then too bad. Go look it up yourself. The name of the game in 2013 was absolute performance and so that is what we are measuring in 2014 with these ETF experiments.

And that ladies and gentlemen, is about all there is to basic asset management. Here’s the basic formula: Follow some prevailing trends to cover career risk + buy some contrarian plays based on quantitative models to cover career risk = hopefully benchmark beating results…and winning the grand prize of more AUM, which inevitably leads to diminishing performance. Obviously, I’m highly generalizing here. Asset management in any shape or form is usually performed by very well educated individuals or groups utilizing highly sophisticated quantitative or fundamental models drawn from a wealth of experience and knowledge. I don’t mean to belittle that nor do I begrudge anybody able to obtain a position managing assets. At the higher levels it is a very, very lucrative career that can build high-quality, long-lasting relationships.

For now, I’ll continue to trade my accounts, spend time with my family, post to my blog, and pursue interests. Am I going to be nominated for fund manager of the year for my efforts? Certainly not; but I just may have a shot at Dad’o the Year.

Now this wouldn’t be a real MarginRich.com article, if I didn’t over-chart the reader. So with that, I’ll bid you adieu with a few charts to provide entertainment and food for thought. Charts are courtesy of some of the financial blogosphere’s most respected, TRB, Jesse, and Kimble.

The January Effect:clip_image010

The Recovery:clip_image012

Is the financial system stressed?:clip_image014

Below is the final “Portfolio Update” posted on 1/4/2015:

Here’s where I’ll maintain the updates to the ETF portfolios that I outlined in the January 2014 post titled, A Few Sample ETF Portfolios to Watch. If you haven’t read it and are curious as to the rhyme and reason behind these experimental portfolios, then please read the post for a full explanation. The portfolios all started with a “play-money” value of $100K. We’ll see how “buy & hold” closes out 2014. CLICK ON EACH TO ENLARGE.

Update 1/4/2015:  Say goodbye to 2014, the year of nothing specifically working except holding everything. Obviously, the adroit speculator was able to generate income in various and specific asset classes. However, the casual investor trying to pick stocks or even the majority of hedge fund managers were both trounced again by a levered ETF of the S&P 500. So much for trying to follow the trend while also also trying to be contrarian. That little thought experiment crashed and burned. I have a strong suspicion that indexing ain’t gonna be as easy as it’s been the last 2 years but who knows. I’ll leave these results up for the rest of the month and then bid adieu to this specific page regarding the 2014 experimental portfolios. Maybe I’ll come up with something else to add to the site, but at the rate I’ve been posting, don’t get your hopes up. Good luck in 2015, muppets!

1. Look Back & Ahead as of 12/31/2014:Look Back & Ahead (2014 Year End)

2. S&P 500 as of 11/18/2014:
S&P 500 (2014 Year End)

3. Levered Look Back & Ahead as of 12/31/2014:Levered Look Back & Ahead (2014 Year End)

4. S&P 500 2x Levered as of 12/31/2014:Ultra S&P 500 (2014 Year End)

5. Contrarian New Year as of 12/31/2014:

Contrarian New Year (2014 Year End)

Some Things Matter and Some Things Don’t In the Financial World

Whoo boy! Talk about an explosive over-reaction to the Fed tapering. The US central bank has tapered their debt monetization from $85B monthly to $75B monthly or $1.02 trillion annually to a paltry $900 billion annually. So the “one-time” TARP bail-out of $700B to save the US banking system and the US economy was so unprecedented that hard assets like precious metals, farm land, and such were driven to extreme levels. The Fed upped that number to a trillion annually and people celebrate because Bernanke has placed a Put under the market. Any threat of excessive inflation in the core CPI has been eliminated and market participants celebrate easing and tapering with virtually equal fervor.

These are truly interesting times for investors. And since it is the most wonderful time of the year, why not get a seasonal bump in equity prices too? Everyone deserves to feel wealthier. It’s the American way.

I recognize that things appear to be looking up economically in the US and since America controls the world’s reserve currency, that should positively affect the rest of the planet. GDP is slowly but surely looking up as some growth projections show anywhere from 3.5% to 4.1% for the US in 2014. Core CPI is tamed so who am I to dispute or rain on any of this optimism? All the same, I think we should visit a list of some things that just don’t seem to matter anymore in the world. We’re looking predominantly in the financial world, but we can’t avoid a couple of views on politics either. As usual, I’ll trot out some charts to help illustrate the good and bad, where applicable.

1. To get the party started, let’s start with inflation. It’s one of the touchier economic subjects out there. There are those who are of the opinion that observing the core CPI and its tame 1.2ish% is the total story. That of course ignores the following chart of growth in the CPI since the 70’s and the advent of excess credit to fund the American lifestyle.

clip_image001

The funny thing about core CPI is that it excludes energy and food, aside from housing, the two biggest components that hard-earned money is spent on. Additionally, hard assets and financial assets are ignored by the focus on core CPI. Hard assets(ex-precious metals) have been rising like gangbusters in 2013. Fine art, diamonds, fine watches, fine & classic cars, and farmland are all being sold for record prices. Is this asset price inflation irrelevant?

How about equity prices in 2013? Is the rocket ride across all indices simply a matter of business fundamentals? Partly. Multiple expansion? Partly. Worldwide liquidity tidal wave? Definitely. Does it really matter though? Wealth is growing…or at least the Fed thinks people will perceive their wealth to be growing and thus spend more to organically grow the economy.

The fact of the matter is that the YoY rate of change in the core CPI has been basically flat, or as neo-Keynesians and monetary sophists say, non-existent. Since monetary inflation is apparently meaningless, this means that the Fed has everything under control. If or when the need to tighten up policies to rein in any perking up cost-push inflation, the Fed will pull the appropriate levers and all will be good. That continues to be a prevailing mindset.

2. Debt monetization i.e. QE is simply overlooked as the price of doing business in growing the equity markets. As I previously noted, market participants were aghast at the sheer size of the original TARP. Now we can’t live without it, but it’s tapering. According to a Bloomberg survey of 41 economists, the median forecast is for the Fed to taper by $10B over the next 7 FOMC meetings until there is no longer any sort of QE. Do you agree? That’s a tough one to swallow. Below you can see the growth in the M2 money stock since the turn of the century.

clip_image002

I have read that this chart can be regarded as irrelevant for a couple of reasons. One is that the creation of this money is simply a balance sheet transaction. Federal debts are monetized, but only sit on the balance sheets of the participating banks as excess reserves. Thus, there is not the requisite rise in costs that historically accompany such transactions because those excess reserves are not being spread around. The next chart shows the velocity, or rather lack there of, in the M2 and it’s a major reason why deflationists and current believers in the status quo believe there are no or will be no repercussions for excessive debt monetization.

clip_image003

This chart above is leading many to believe that everything is under control. Of course, any rational follower of economics and the markets know that it will be the unintended consequences and unforeseen actions that will shift the velocity upward. And by unforeseen, I mean things that are completely foreseeable such as a shift in international confidence in the USD or a marked increase in the Renminbi for transactional settlement at the sovereign level or a significant reduction in the use of the Petro dollar for energy settlement. The current logic goes that excess reserves will be coaxed out by the banks’ greed for yield and earnings, as the spigot is eventually closed. Then the US should see some of that cost-push inflation that was so widely anticipated after 2009.

As it stands, there is a terrifically tight correlation between 10-year US Treasury yields and money velocity. Since everyone and their mother expects the fixed income market to lift the yield of Treasuries, it stands to reason that velocity will be joining the ride. Everything is always about timing, though. None the less, observe the following chart courtesy of Business Insider, via Harrell at Loomis Sayles.

clip_image005

3. But in the meantime, the co-policy of ZIRP which has helped to enable the efficacy of QE has destroyed what it means to traditionally and conservatively save your money. ZIRP is forcing everyone to speculate, plain and simple. Savings accounts and CD’s pay nothing. Because of that, more and more reach for yield through the dividends of the stock markets. Even the high-yield debt market continues to perform robustly and I suspect it will continue until the T-rates begin to officially rise. The lack of spread between HY and plain old Treasuries is beginning to hit what, since 1997, has traditionally been the early part of a danger zone. Observe the following chart from Bespoke.

clip_image006

It shows we still have some time to go before confidence erodes, but as a canary in the coal mine, a message is being provided loud and clear to those potentially stretching a little too far for yield.

4. Can anyone honestly look at official unemployment reports and not raise an eyebrow? The BLS is currently showing an unemployment rate of 7%. Fantastic! America’s well on it’s way towards full employment again. Except there’s that nagging little fact that the entire demographic of individuals who have given up looking for work are simply not labeled as unemployed and thus do not factor into the equation. So if you gave up looking for work and still don’t have a job, not to worry. You don’t qualify for unemployment benefits anymore and we won’t count you as unemployed because you’ll receive a different form of welfare. Win-win.

It’s difficult to ignore the glaring convergence between the reducing unemployment rate and the continued decline in the workforce participation rate in the US. Have a look at the chart below of workforce participation over the last 10 years, courtesy of BI, via Gunha at ISI.

clip_image008

The Philly Fed states that this rate is entirely caused by workers entering retirement. Obviously, retirees factor into the equation but to state that the descent, which coincides with the nadir of the Great Recession, is entirely related to retiring workers is bold. “But it’s backed by statistics! I read the report.” Yeah, sure. Ok. Statistics are never presented in such a way to influence the thinking of others.

5. Capital expenditures and the organic growth of the economy are simply not a priority for now. CapEx levels provide that behind-the-scenes, real snapshot of economic growth, and for now, CapEx is in the dumps. Businesses simply do not want to risk the capital to expand or grow sales and the work force. Instead, the current business fads are buy-backs and dividend increases. Selfishly, I’m all about the share repurchases and dividend growth in my own long-term holdings. But to use cheap capital or current cash flows for such short term benefits with little to no thought on how to build for the future seems a bit backwards to me. Getting by with less is SOP for so many corporations since 2008, but at some point CapEx will have to pick up, because SG&A can only be sliced and diced for so long to help generate earnings.

Have a look at this chart, also from BI, courtesy of Soss at Credit Suisse. It displays the ratio of business fixed investments to corporate cash flows. You can see it is still at its lowest points over the last 50 years. Corporations just don’t want to spend their money on CapEx.

clip_image010

Now that squiggle-pic above just depicts what corporations are willing to spend from out of their own kitty. Despite all the access to cheap capital for the corporations to borrow in order to finance the future, there isn’t a pick-up in that area for CapEx either. Observe the following chart, additionally from BI, via Chandler at Brothers Brown Harriman.

clip_image012

Just look at that spread on the right side of the chart. It’s very telling of the current methods being utilized to generate further corporate earnings without the CapEx investment to build a solid foundation for future earnings growth. At some point soon though, that spread will begin to converge as the US should see genuine economic progress. Companies will actually begin to invest in their future as opposed to just provide shareholder value through buy-back’s and divvy’s.

This is very important, because even though CapEx doesn’t seem to matter right now, at some point it could be a key point in the inflation argument. The scenario has the potential to play out like this: economic growth picks up and so maybe the Fed moves rates up just a quarter percent or whatever. Banks get scared that their Fed window cash machine is going to go bye-bye so they increase lending across many facets of their operations. Companies begin borrowing the still cheap capital to invest in operations and hiring actually picks up. This begins the upward shift in money velocity which should then begin to push prices upward. This is a scenario that investors will want to keep their eyes on, because it has the potential to make you a lot of money as markets grow, but it could be the mask that covers the arrival of the next financial crisis. Because we all know, nobody ever sees the next financial crisis coming.

6. Sovereign debts and sovereign solvency are issues that are front and center and yet hidden in plain sight. The numbers are simply so huge that it’s as if nobody cares anymore. Central banks are able to keep rates at or near zero percent and gin up funding on demand, so everything is under control. Unfunded liabilities are on the back burner as massive liquidity continues to be mistaken for solvency. Developed nations around the world have debt levels that are between 1:1 to 2:1 of GDP and it doesn’t matter. Here’s what matters:

clip_image013

7. The old banking model is dead and has been dead since the repealing of Glass-Steagall but really even earlier than that with the creation of mortgage backed securities. The so popularly and prevalently quoted old banking model was the 3-6-3 of borrow at 3% – lend at 6% – be on the golf course at 3pm. Banking pretty much used to be that simple. That’s how it should be. Banks shouldn’t be systemically risky to the entire world economy. And if the regulators around the world were actually doing their job, then these SIFI’s wouldn’t be SIFI’s. Banks now simply take in as much capital as they can and use it as collateral across the spectrum of their “sophisticated” trading operations.

Why lend to entrepreneurs or businesses in need when you can lend to sovereigns and use that asset as collateral in additional transactions in an endless chain of profit generation. The widespread acceptance of the current banking model is truly a thing to behold. Have a look at a couple of countries from over in Europe who simply appear to be clueless. This chart from BI, via Commerz Bank, shows how the Italian and Spanish banks are simply reflating their balance sheets in an attempt to stay resuscitated for as long as possible before the ECB starts monetizing like they’ve promised. Unbelievably, the entities that need access the most to that capital to help grow each respective economy is barred from access as the banks maintain their favorability to “govie” holdings.

clip_image015

There has been so much debt created between the sovereigns and the SIFI’s and so many derivatives are traded underneath it all to keep the illusion of solvency alive that nobody knows what’s what anymore. In a previous post last June, I expounded fairly extensively on the derivatives rife throughout the banking system. Click the link and have a read if you’re inclined. The old banking model is dead and I suspect that even after the next crisis, the system still won’t be cleansed of the systemic risk of the new banking era. If and or when a serious dislocation arrives, I’ll hold out hope for real, positive change that creates a balanced financial platform from which the world of finance, investing, banking, and economics can work. I ain’t holding my breath.

8. I don’t want to go off the deep end of a rant here after sharing what I think I are some important notions to consider in understanding some concepts behind the macro economic and financial outlook, but a couple of comments on statesmanship and justice are warranted. Civic duty in the political arena appears to be as dead as the old banking model. It really seems as if the Boomer politicians with their 60’s era non-inhaling, non-conformity or 70’s era dancing in polyester have forgotten what it means to build and develop a nation. Even the the X’ers in positions of power are infected by the commercialism they were so subjected to as youth. Both groups who control US politics seem to be consumed with consolidating and maintaining a power base, as opposed to building a nation up and maintaining an image of America as a fair, free world power. Obviously, these statements are highly generalized and that’s all I gots to say about politics.

As for justice, where is it for the bankers? Where is it for the corrupt? I realize it’s a tired question, but it’s difficult to let go. When you hear responses from Eric Holder on a slew of subjects, you just want to puke…literally. A handful of traders take the fall for the Great Recession. No banking executives are indicted in America, but during the S&L crisis going into the 90’s, hundreds of banking of executives were incarcerated and indicted for their malfeasance. Look at Iceland’s accountability of the executives from their largest banks; convicted and sentenced already. Is Iceland, an island of 300,000 people, a model of financial reform that America should be closely following? Not necessarily. That’s not the point. The point is you have a sovereign nation that held those accountable who deserved to be held accountable in the banking system. Enough about that as well.

9. The last notion on the list of things that don’t matter is volatility in the equity markets. No need to go short or hedge as you can simply go long and outperform on an absolute basis. That’s what ample liquidity across the world does. It drives up certain asset prices, and stocks are the asset du jour to be driven up by current liquidity levels in the economy. Volatility is one of those funny things though, where it doesn’t matter until it does in a very big way.

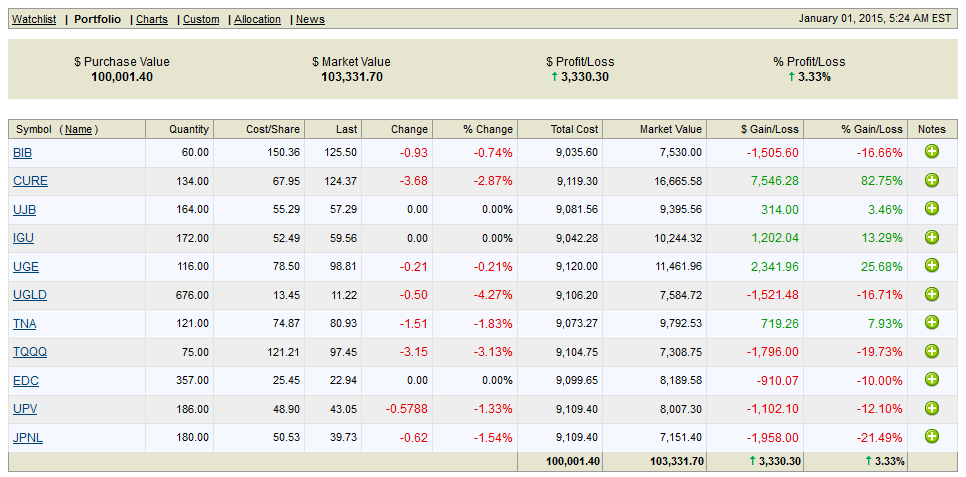
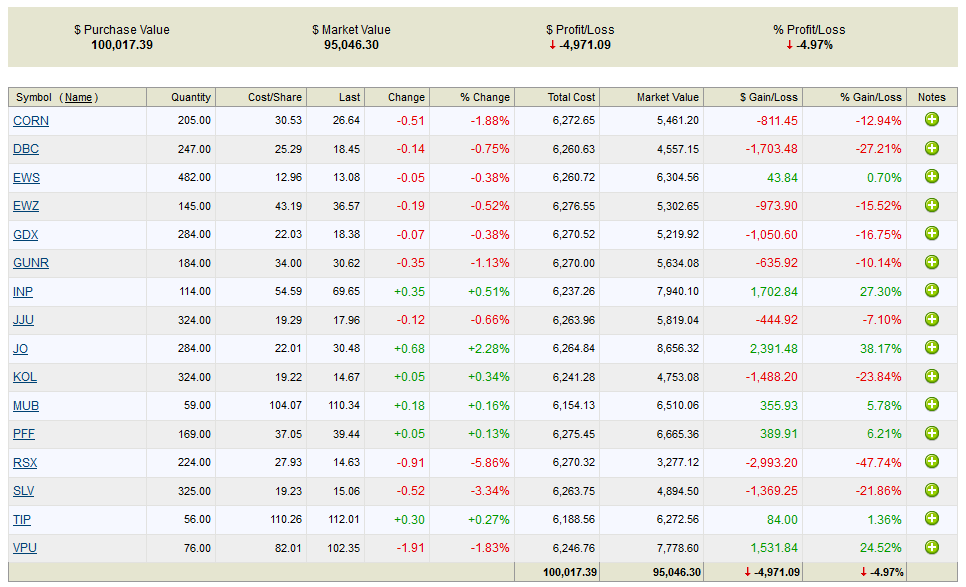
It does appear as if now may be a dangerous time to enter new positions as things seem a bit frothy, but as the liquidity continues to flow and the volatility is non-existent, it may be more imprudent to not get positioned going into the new year. At this point, hoping for a correction just to get the absolute best price on new positions may prove to be unsound. But then again, so could diving into new positions just to potentially play catch-up. For now it does appear as if the economy may begin to mend, and when combined with liquidity levels, ZIRP, and the general trend, one has to position their portfolio accordingly.

In my next post, I’d like to share a simple portfolio that may be able to take advantage of the current trends while hedging some of the correction risk; in addition to taking a contrarian stance in some of the positions. If I don’t share another post this week, have a great holidays and happy new year. And thank you so, so much for taking the time to stop by my site and having a read.